STATEMENT OF FINANCIAL POSITION
(MNT million)
| 1 | ASSETS | ||
| 1.1 | Cash and cash equivalents |
185,800 |
|
| 1.2 | Due from banks and financial institutions |
39,169 |
|
| 1.3 | Financial investments |
7,359 |
|
| 1.4 | Loans and advances to customers (net) |
642,972 |
|
| 1.4.1 | Performing loans |
612,821 |
|
| 1.4.2 | Non-performing loans |
58,444 |
|
| 1.4.3 | Deferred loan payment |
(140) |
|
| 1.4.4 | Accrued interest receivable |
13,112 |
|
| 1.4.5 | Loan loss provision |
(41,265) |
|
| 1.5 | Derivative financial assets |
1,676 |
|
| 1.6 | Other financial assets |
455 |
|
| 1.7 | Other non-financial assets |
13,121 |
|
| 1.8 | Fixed assets |
17,592 |
|
| 1.9 | Properties held for sale |
17,799 |
|
| 1.10 | Intangible assets |
13,511 |
|
| 1.11 | Total assets |
939,454 |
|
| 2 | LIABILITIES | ||
| 2.1 | Current accounts |
40,476 |
|
| 2.2 | Savings accounts |
347,440 |
|
| 2.3 | Due to banks and financial institutions |
307,598 |
|
| 2.4 | Other funds |
14,162 |
|
| 2.5 | Derivative financial liabilities |
2,990 |
|
| 2.6 | Other liabilities |
24,340 |
|
| 2.7 | Total liabilities |
737,006 |
|
| 3 | EQUITY | ||
| 3.1 | Share capital |
146,474 |
|
| 3.2 | Share premium |
15,647 |
|
| 3.3 | Treasury shares |
(7,032) |
|
| 3.4 | Retained earnings |
47,260 |
|
| 3.5 | Other reserves |
99 |
|
| 3.6 | Total equity |
202,448 |
|
| 4 | TOTAL LIABILITIES AND EQUITY |
939,454 |
|
(MNT million)
| OFF BALANCE SHEET | |
| Contingencies and commitments (net) |
11,553 |
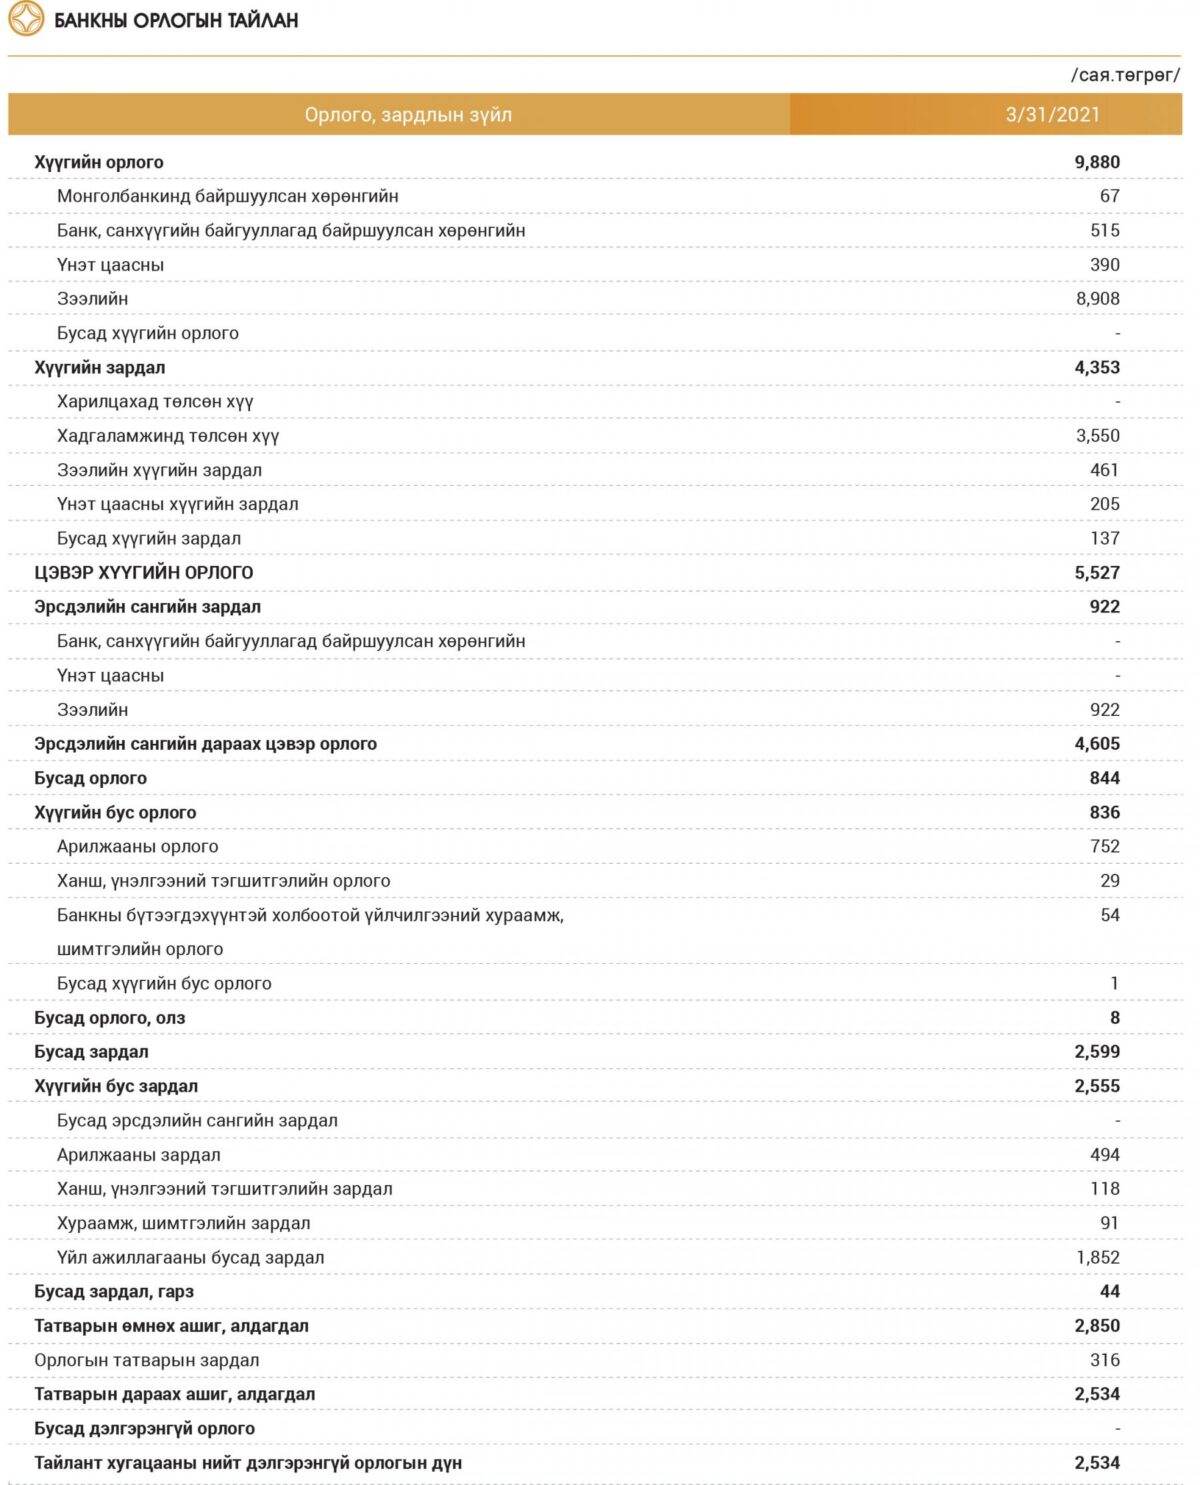
INCOME STATEMENT
(MNT million)
| 1 | Interest income |
62,130 |
| 1.1 | From Bank of Mongolia |
118 |
| 1.2 | From banks and financial institutions |
573 |
| 1.3 | From securities |
4,142 |
| 1.4 | From loans |
56,158 |
| 1.5 | Other interest income |
1,139 |
| 2 | Interest expense |
42,128 |
| 2.1 | Interest expense on current accounts |
826 |
| 2.2 | Interest expense on savings accountsХадгаламжид төлсөн хүү |
28,503 |
| 2.3 | Interest expense on borrowed funds |
9,844 |
| 2.4 | Interest expense on securities |
283 |
| 2.5 | Other interest expenses |
2,672 |
| 3 | Net interest income (1-2) |
20,002 |
| 4 | Provision expense |
3,363 |
| 4.1 | Deposits at banks and financial institutions |
– |
| 4.2 | Securities |
– |
| 4.3 | Loans |
3,363 |
| 5 | Net income after provision (3-4) |
16,639 |
| 6 | Other income |
12,381 |
| 6.1 | Non-interest income |
12,246 |
| 6.1.1 | Trading income |
4,921 |
| 6.1.2 | Foreign exchange and revaluation income |
6,448 |
| 6.1.3 | Fees and commission income |
760 |
| 6.1.4 | Other non-interest income |
117 |
| 6.2 | Other income, gain |
135 |
| 7 | Other expenses |
22,797 |
| 7.1 | Non-interest expenses |
22,468 |
| 7.1.1 | Other provision expense |
925 |
| 7.1.2 | Trading expense |
2,138 |
| 7.1.3 | Foreign exchange and revaluation expense |
5,975 |
| 7.1.4 | Fees and commission expense |
800 |
| 7.1.5 | Other operating expenses |
12,630 |
| 7.2 | Other expenses, losses |
329 |
| 8 | Profit Before Tax (5+6-7) |
6,223 |
| 9 | Income tax expense |
674 |
| 10 | Net profit for the year (8-9) |
5,549 |
| 11 | Other comprehensive income |
– |
| 12 | Total comprehensive income for the year (10+11) |
5,549 |
| PRUDENTIAL RATIOS BY THE BANK OF MONGOLIA | LIMIT | PERFORMANCE |
| Tier 1 capital ratio | ≥ 9% | 24.3% |
| Capital adequacy ratio | ≥ 12% | 24.3% |
| Liquidity ratio | ≥ 25% | 30.8% |
| Foreign currency open position ratio (single currency) | < ±15% | 8.4% |
| Foreign currency open position ratio (total) | < ±30% | 10.4% |
| LOANS AND ADVANCES TO RELATED PARTIES | CATEGORY OF ASSETS | BALANCE (MNT million) |
PERCENT OF TOTAL EQUITY | |
| 1 | Loans and advances to a related party (less than 5% of total equity) | 3.2% | ||
| 1.1 | Bank shareholders | – | – | 0.0% |
| 1.2 | Key management personnel | – | – | 0.0% |
| 1.3 | Other related parties | Loan | 6,449 | 3.2% |
| 2 | Total loans and advances to related parties (less than 20% of total equity) | 11.9% | ||
| 2.1 | Bank shareholders | Loan | 100 | 0.0% |
| 2.2 | Key management personnel | Loan | 532 | 0.3% |
| 2.3 | Other related parties | Loan | 23,590 | 11.6% |